Math 302 quiz 1 Samenvattingen, Aantekeningen en Examens
Op zoek naar een samenvatting over Math 302 quiz 1? Op deze pagina vind je 250 samenvattingen over Math 302 quiz 1.
Alle 250 resultaten
Sorteer op

-
MATH 302 Quiz 1 - Question and Answers
- Tentamen (uitwerkingen) • 172 pagina's • 2023
- $16.59
- + meer info
MATH 302 Quiz 1 - Question and Answers
-
MATH 302 Quiz 1 Set 1
- Tentamen (uitwerkingen) • 11 pagina's • 2022
- $9.99
- + meer info
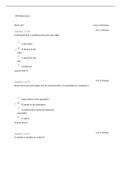
MATH 302 Quiz 1 1. An advertisement for a car states that it is 10% more powerful than its competitor. This is an example of 2. A scatterplot allows one to see: 3. Which of the following are the two most commonly used measures of variability? 4. A histogram that has a single peak and looks approximately the same to the left and right of the peak is called: 5. What kind of relationship between x and y is demonstrated by the scatter plot below? 6. Which of the following statements is true re...

-
MATH 302 Quiz 1 - Question and Answers
- Tentamen (uitwerkingen) • 171 pagina's • 2023
- $40.99
- + meer info
MATH 302 Quiz 1 - Question and Answers
-
MATH 302 Quiz 1 - Question and Answers
- Tentamen (uitwerkingen) • 11 pagina's • 2022
- $11.99
- + meer info
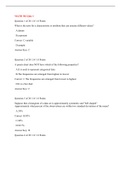
MATH 302 Quiz 1 Part 1 of 3 1. A histogram that is positively skewed is also called 2. Researchers may gain insight into the characteristics of a population by examining a 3. A variable is classified as ordinal if: 4. A sample of 20 observations has a standard deviation of 4. The sum of the squared deviations from the sample mean is: 5. A pareto chart does NOT have which of the following properties? 6. What type of graph is the figure below? 7. Numerical variables can be subdivided i...
-
MATH 302 Quiz 1 Set 3
- Tentamen (uitwerkingen) • 9 pagina's • 2022
- $11.99
- + meer info
Math 302 quiz 1 1. What is the term for a characteristic or attribute that can assume different values? 2. A pareto chart does NOT have which of the following properties? 3. Suppose that a histogram of a data set is approximately symmetric and "bell shaped". Approximately what percent of the observations are within two standard deviations of the mean? 4. Suppose that a histogram of a data set is approximately symmetric and "bell shaped". Approximately, what percent of the observations ar...

Fear of missing out? Hoeft niet!


-
MATH 302 Quiz 1_Questions with Answers
- Tentamen (uitwerkingen) • 8 pagina's • 2024
- $14.49
- + meer info
MATH 302 Quiz 1_Questions with Answers

-
MATH 302 Quiz 1 - Question and Answers
- Tentamen (uitwerkingen) • 171 pagina's • 2023
- $45.49
- + meer info
MATH 302 Quiz 1 - Question and Answers

-
MATH 302| STATISTICS| WEEK 6 QUIZ WITH ANSWERS| 2024
- Tentamen (uitwerkingen) • 21 pagina's • 2024
- $13.49
- + meer info
MATH 302| STATISTICS| WEEK 6 QUIZ WITH ANSWERS| 2024 Question 1 (1 point) A manager wants to see if it worth going back for a MBA degree. They randomly sample 18 managers' salaries before and after undertaking a MBA degree and record their salaries in thousands of dollars. Assume Salaries are normally distributed. Test the claim that the MBA degree, on average, increases a manager's salary. Use a 10% level of significance.

-
MATH 302| STATISTICS| WEEK 1 QUIZ| 2024| AMERICAN MILITARY UNIVERSITY
- Tentamen (uitwerkingen) • 9 pagina's • 2024
- $13.49
- + meer info
MATH 302| STATISTICS| WEEK 1 QUIZ| 2024| AMERICAN MILITARY UNIVERSITY Question 1 1 / 1 point Duration (amount of time) is what type of data in the scenario? A study was done to determine the age, the number of times per week, and the duration (amount of time) of residents using a local park in San Antonio, Texas. The first house in the neighborhood around the park was selected randomly, and then the resident of every eighth house in the neighborhood around the park was interviewed. Que...

-
MATH 302| STATISTICS| WEEK 2 QUIZ WITH ANSWERS| 2024
- Tentamen (uitwerkingen) • 14 pagina's • 2024
- $11.49
- + meer info
MATH 302| STATISTICS| WEEK 2 QUIZ WITH ANSWERS| 2024 0 / 1 point An instructor wantsto compare spread (variation) of final grades ofstudentsin her online class and face-to-face class. The instructor selects 10 students randomly from each class and the following table shows the final grades of those students. See Attached Excel for Data. final grade The standard deviation of final gradesfor the online class is 7.832269 7.83 Use the information to respond to the following question:(roun...
