All 5 results
Sort by
Best selling Loose Leaf for Business Statistics: Communicating with Numbers notes

-
Test Bank for Business Statistics Communicating With Numbers 2nd Edition Jaggia Full Chapter | 100% Solved
- Exam (elaborations) • 203 pages • 2024 Popular
-
- $32.49
- + learn more
Test Bank for Business Statistics Communicating With Numbers 2nd Edition Jaggia Full Chapter | 100% Solved. A frequency distribution for qualitative data groups these data into classes called intervals and records the total number of observations in each class. True False 2. The relative frequency of a category is calculated by dividing the category's frequency by the total number of observations. True False 3. The percent frequency of a category equals the frequency of the category multi...

-
Test Bank for Business Statistics Communicating With Numbers 2nd Edition Jaggia Full Chapter 2024/2025
- Exam (elaborations) • 203 pages • 2024 Popular
-
- $33.49
- + learn more
Test Bank for Business Statistics Communicating With Numbers 2nd Edition Jaggia Full Chapters 2024/2025. The relative frequency of a category is calculated by dividing the category's frequency by the total number of observations. True False 3. The percent frequency of a category equals the frequency of the category multiplied by 100%. True False 4. A pie chart is a segmented circle that portrays the categories and relative sizes of some quantitative variable. True False 5. A bar chart d...

-
Test Bank for Business Statistics Communicating With Numbers 2nd Edition Jaggia Full Chapter 2024/2025
- Exam (elaborations) • 203 pages • 2024 Popular
-
- $30.49
- + learn more
Test Bank for Business Statistics Communicating With Numbers 2nd Edition Jaggia Full Chapterss 2024/2025. The relative frequency of a category is calculated by dividing the category's frequency by the total number of observations. True False 3. The percent frequency of a category equals the frequency of the category multiplied by 100%. True False 4. A pie chart is a segmented circle that portrays the categories and relative sizes of some quantitative variable. True False 5. A bar chart ...
Do you also write study notes yourself? Put them up for sale and earn every time your document is purchased.

-
Test Bank for Business Statistics Communicating With Numbers 2nd Edition Jaggia Complete Full Chapters | VERIFIED.
- Exam (elaborations) • 203 pages • 2024 Popular
-
- $30.49
- + learn more
A frequency distribution for qualitative data groups these data into classes called intervals and records the total number of observations in each class. True False 2. The relative frequency of a category is calculated by dividing the category's frequency by the total number of observations. True False 3. The percent frequency of a category equals the frequency of the category multiplied by 100%. True False 4. A pie chart is a segmented circle that portrays the categories and relative s...
Newest Loose Leaf for Business Statistics: Communicating with Numbers summaries

-
Test Bank for Business Statistics Communicating With Numbers 2nd Edition Jaggia Full Chapter 2024/2025
- Exam (elaborations) • 203 pages • 2024 New
-
- $33.49
- + learn more
Test Bank for Business Statistics Communicating With Numbers 2nd Edition Jaggia Full Chapters 2024/2025. The relative frequency of a category is calculated by dividing the category's frequency by the total number of observations. True False 3. The percent frequency of a category equals the frequency of the category multiplied by 100%. True False 4. A pie chart is a segmented circle that portrays the categories and relative sizes of some quantitative variable. True False 5. A bar chart d...

-
Test Bank for Business Statistics Communicating With Numbers 2nd Edition Jaggia Full Chapter | 100% Solved
- Exam (elaborations) • 203 pages • 2024 New
-
- $32.49
- + learn more
Test Bank for Business Statistics Communicating With Numbers 2nd Edition Jaggia Full Chapter | 100% Solved. A frequency distribution for qualitative data groups these data into classes called intervals and records the total number of observations in each class. True False 2. The relative frequency of a category is calculated by dividing the category's frequency by the total number of observations. True False 3. The percent frequency of a category equals the frequency of the category multi...

-
Test Bank for Business Statistics Communicating With Numbers 2nd Edition Jaggia Full Chapter 2024/2025
- Exam (elaborations) • 203 pages • 2024 New
-
- $30.49
- + learn more
Test Bank for Business Statistics Communicating With Numbers 2nd Edition Jaggia Full Chapterss 2024/2025. The relative frequency of a category is calculated by dividing the category's frequency by the total number of observations. True False 3. The percent frequency of a category equals the frequency of the category multiplied by 100%. True False 4. A pie chart is a segmented circle that portrays the categories and relative sizes of some quantitative variable. True False 5. A bar chart ...
Do you also write study notes yourself? Put them up for sale and earn every time your document is purchased.

-
Test Bank for Business Statistics Communicating With Numbers 2nd Edition Jaggia Complete Full Chapters | VERIFIED.
- Exam (elaborations) • 203 pages • 2024 New
-
- $30.49
- + learn more
A frequency distribution for qualitative data groups these data into classes called intervals and records the total number of observations in each class. True False 2. The relative frequency of a category is calculated by dividing the category's frequency by the total number of observations. True False 3. The percent frequency of a category equals the frequency of the category multiplied by 100%. True False 4. A pie chart is a segmented circle that portrays the categories and relative s...
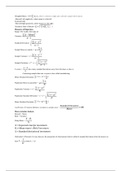
Chapter 3 Textbook Notes for GB213

How much did you already spend on Stuvia? Imagine there are plenty more of you out there paying for study notes, but this time YOU are the seller. Ka-ching! Discover all about earning on Stuvia

